Once again this year, we have analyzed our carbon footprint in order to understand, manage and reduce the impact that our activities have on climate change. This report reflects our commitment to truthfulness and transparency.
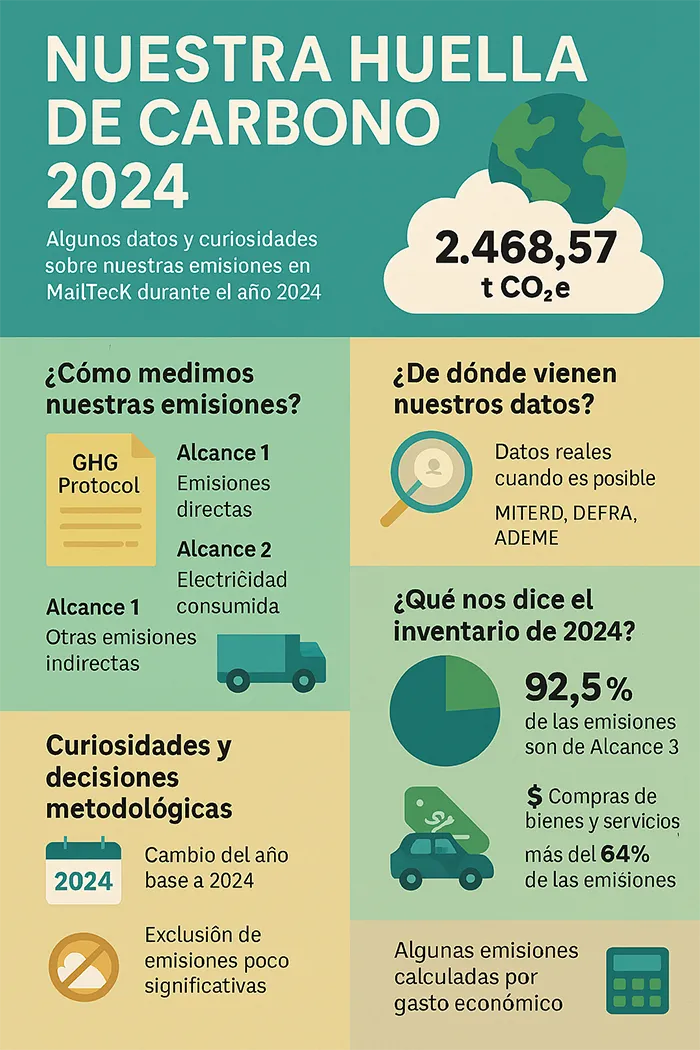
And the result was: 2,468.57 t CO2e, we explain how it is measured and what it means.
📏 How are emissions measured?
We use the international standard GHG Protocol, which divides emissions into three major groups called “scopes”:
- Scope 1: Direct emissions, such as fuel from our vehicles or refrigerant leaks (air conditioning recharges).
- Scope 2: Indirect emissions from the purchase of electricity.
- Scope 3: Broader indirect emissions, such as those from the products we buy, employee commuting, transportation of goods, and waste treatment. Scope 3 has several categories, some of which are complex to calculate. This is where we have made every effort to calculate them for the period 2024.

🔍 Where does our data come from?
We prioritize direct data whenever possible: electricity bills, liters of fuel refueled, kilometers traveled, tons of paper purchased… When there is no direct data, we use estimates based on economic expenses or data capture from internal surveys, such as the Commuting to Work Survey that you receive annually.
Emission factors (how much CO₂ each activity generates) come from official sources such as the Ministry for Ecological Transition (MITERD), and other international sources.
📊 What does our 2024 emissions data say?
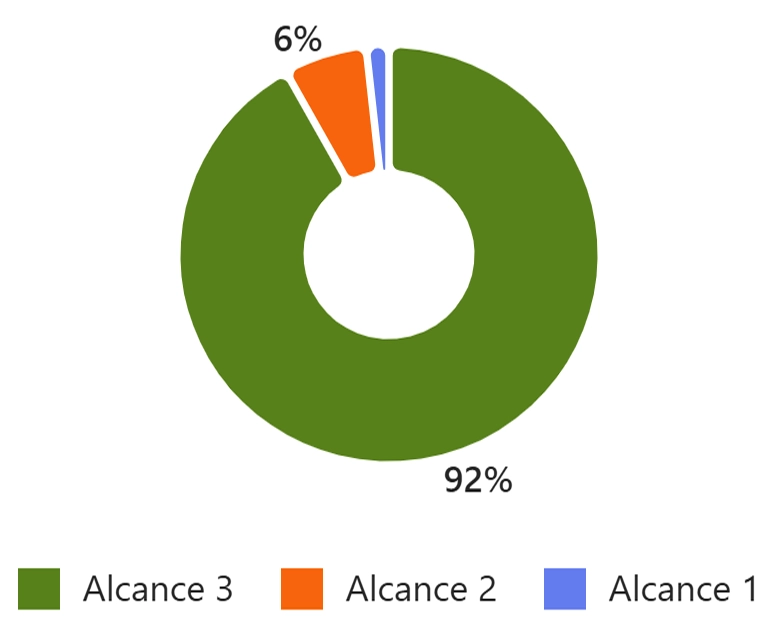
- 92.5% of our emissions come from Scope 3, which reflects that the greatest impact is in indirect activities over which we have less control than direct ones. This is the case of emissions produced by our suppliers.
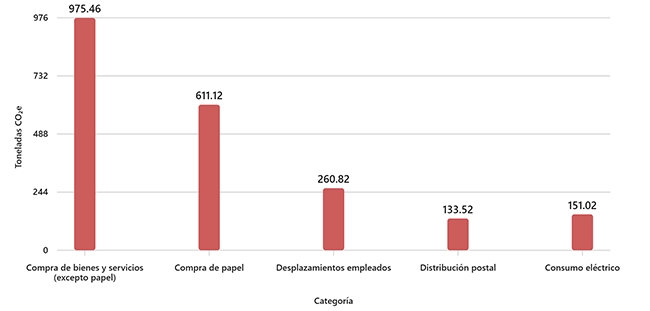
- Within this scope 3, purchases of goods and services (including paper) represent more than 64% of our emissions.
- Employee commuting generates 260.82 tCO₂e, equivalent to 10.57% of the total. They also belong to Scope 3.
- Electricity consumption (Scope 2) represents only 6.12%, thanks to the majority purchase of green energy in 2024.
- This means that our direct emissions are not high and we will be able to reduce or offset them, but we will have to require our suppliers in the supply chain to make commensurate efforts to reduce their emissions.

🚀 What now?
We have changed the base year to 2024, as we have expanded the categories measured in Scope 3, which makes the data not comparable with previous years. The advantage is that, from this year onwards, the results will be comparable with each other, as we will maintain the reported categories over time.
This report not only helps us to meet our environmental commitments, but also allows us to identify opportunities for improvement. For example, choosing paper suppliers with a smaller product footprint, or that are closer to our plant.
All companies are called upon to reduce their carbon footprint by 2050 in order to minimize climate change.


